Introduction: Real Diffusion Experiment (for Home or School)


As part of my research and my physics degrees I've been studying a lot about diffusion and diffusion-related subjects. After a while it finally hit me that I learned about diffusion before - in my highschool biology class. I thought about the experiments they showed us, and something didn't make sense. So I searched YouTube for diffusion demonstrations, and they looked pretty much the same - someone drops a bit of dye into a large water-filled beaker, and after a few minutes the entire beaker is colored.
At this point I realized how big the misconception about diffusion is! Most diffusion demos are completely wrong!
As I'll show you soon enough, diffusion on these scales takes weeks to happen! All of these demos in fact show a process called 'convection' in which the dye mixes due to currents and swirls in the liquid, not due to diffusion.
So, in this instructable I'll first try to convince you that there's something wrong with these experiments, and that we should re-evaluate how we demonstrate diffusion to student. Then, I'll show you how you can perform diffusion experiments the right way (there's more than one way, of course!). Finally, I'll discuss some of the consequences of the results, which can actually teach us a lot about the world we're living in.
My hope is that - if I convince you that the typical diffusion demos are wrong - you spread the word! Teach the ones you can! And on the other hand, if you think that I'm wrong here - I'd love to hear your opinion, see your experimental data, and talk about it!
I've been waiting to make an instructable about this subject for a while now, but I never really got to it. Finally, the science fair contest motivated me getting it done and posting this article :) I hope you like it!
I made a video about this project for those who like watching narrated videos
If you have any questions or comments, I'd love to hear all of them!
Step 1: What's Wrong With Typical Diffusion Demos


In the diffusion demonstrations we're used to seeing, the main things that cause the dye to mix are not diffusion. It is swirls and currents in the liquid, a process called convection. Most commonly, a drop of dye is injected into a large water-filled beaker, and the audience watch as the color mixes (see the GIF I attached of such experiment I performed myself). The spread of the dye is said to be due to diffusion. However, this is not true. You can clearly see currents and swirls in the liquid (convection).
There are many things that cause the convection. First, the beakers are often wide open and so any currents in the air are transferred to the water, causing them to swirl. Next, since the top of the beaker is open, there's evaporation of water happening (see the drawing I attached). This means that the top of the water container becomes cooler than the bottom. Since cold water is slightly denser, it tends to sink, which leads to currents and swirls again. Finally, these experiments are often done with warm water in intent to show that diffusion is temperature-dependent. However, everything I just mentioned is also enhanced with the increased temperature! The difference between the beaker's temperature and the rest of the room is bigger, and so the water develops an even steeper temperature gradient, which makes everything even worse!
Diffusion, as it turns out, can be very very slow. Humans are used to seeing big things - things on the scale of a mm (1/25") are already pretty small for the human eye. However, diffusion is extremely inefficient at these sizes! Diffusion is fast and efficient only on the scale of microns and smaller, and if you follow along, you'll see exactly why!
This should not be discouraging - the fact that diffusion is slow on large scales - but quick on small scales - explains so much of the world around us, including a lot of biological phenomena, and I'll elaborate on that in the final section.
I'm not trying to say that diffusion experiments are impossible to see and demonstrate, I'm just saying that the most common form of diffusion demos is wrong! There are ways to do it right!
Step 2: Experimental Setup


We need to make sure that convection doesn't happen in our experiment. Here are the things that helped me get it done. I tried skipping some of these, but it didn't work :)
- Use a thin container. Glass test tubes or other things with similar proportions could work. These are pretty cheap, I bought mine from AliExpress.
- We should make sure that when we inject the dye, it doesn't swirl right from the start. To do that, I used salt water (5% salt) instead of tap water. This made them heavier and so the dye floated on them. It doesn't change anything for diffusion (why? you can ask your students questions like this one! let me know if you want the answer), but it helps with the initiating the experiment in a controlled manner.
- Let all of the liquids rest at room temperature before starting. If they have different temperatures, it'll cause convection.
- Inject the dye gently to the top of the container so that it floats at the top. Avoid dropping it from a distance.
- Use plastic wrap or a cork cap to seal the test tube after you initiate the experiment. This will help fight the evaporation and air currents from messing with your experiment.
- Finally, this experiment is best done in a constant environment where the temperature is pretty constant over time. If you want to film it, a good place would be inside a cabinet or a closet.
I used a dye called Fluorescein which is very common in laboratories (often used for diffusion experiments). However, food coloring or ink work perfectly fine. If it's water soluble and has a strong color, it should be fine.
Step 3: Data Capture


Capturing the data is important if we want to have a quantitative understanding of the phenomena. It will also let us see the diffusive behavior as a function of time even though things are moving slowly (see the GIF I attached - that's 48 hours!).
- You want the capture data with a nice clear background. I found that using a black paper works well, but it often depends on the type of food coloring or dye you're using.
- You also want to capture images with constant lighting and camera settings. For that reason, I kept the experiment running inside a closet with a fixed light source :) sunrise & sunset can interfere with your data.
- I found a really nice app called 'Open Camera' (thanks Orit!). It allows you to take timelapse images, set the image resolution, and fix the focus / exposure so it doesn't change automatically. You can also save the data to a google drive folder which means you can check how things are going without opening the closet and having the risk of a ruined experiment. You shouldn't take more than an image every 5-10 minutes. Nothing happens that fast anway, the experiment will probably be running for days.
- Before initiating the experiment, take an image with something of a known size. For example, taking a picture of a ruler would be useful. You'll see more about why this is needed in step 6.
- Initiate the experiment and wait. Take the time and follow the images over your google-drive folder. Try to avoid opening the closet while the experiment is running!
Step 4: Data Analysis Software - 'Tracker' (free Academic Software)


There are many ways analyze the experimental data. I found Tracker can be used in so many physics experiments that it's worth getting to know. It's available in many different languages (not only English), so young students from all over the globe can use it.
Download the Tracker software here. There's an online version but it doesn't work well.
An alternative to 'Tracker' is a software called 'ImageJ' or 'Fiji' (basically the same). It works great too, and has some advanced options too.
To start analyzing your videos, import them. Tracker accepts videos of many formats, but also sequences of images. Note that sequences of images need be named in a fixed format with a incrementing numbers. For example, Img001, Img002, Img003... are good file names (see first image)
You'll often want to rotate the image so that the direction you're interested in is horizontal. To do that, right-click the video, and press filters -> new -> rotate. Rotate the image in the desired direction (see second image).
I've also written a code python to analyze a sequence of images automatically, more about that (file included) in the data-analysis step.
Step 5: Calibrate Pixels to Physical Units


We took images or videos of the real world, but the software has no way of knowing what we're looking at, what's it's size, and how often images were taken. We need to calibrate both space (distances) and time to physical units. You'll need to do this even if you analyze the data in a different software.
To Convert Pixels to Distance Units (GIF #1):
- Select the 'calibration tools' from the toolbar.
- Add a new calibration stick.
- Align it along a known distance. For example, I took a picture of a ruler.
- Calibrate the measured distance. I'm using meters, but you can change to any units you like by pressing the 'Coordinate system' tab -> 'Units...' and setting your preferred system of units.
To Calibrate Time (GIF #2):
- Right-click the video (anywhere on the screen), and press 'Clip Settings'
- Set the frame rate (FPS) or the time interval between images in a sequence (dt). I analyzed images that were taken every 30 minutes, so I set 'dt' to 1800 seconds.
You can set the coordinate system (where x, y = 0) and its orientation on the screen by pressing the coordinate axes tool in the toolbar (see third image).
That's it, from this point on your measurements will be in physical units.
Step 6: Measure the Diffusion Process Over Time


I'm including here 3 different types of analysis. I'll list them in order of complexity, the first one being the easiest one to use but also the least accurate, and the last one being the most complex and accurate method of analysis.
First Method - 'By Eye' (GIF #1):
The food coloring (or whatever ink or chemical you're using as dye) colors the water. We can look for the point where it is no longer visible, and track it's position over time.
- In the 'Tracker' software, press 'Track' -> 'New' -> 'Point Mass'.
- Hold 'Shift' and use the mouse choose the point at which the paint is not longer visible. Each time you click, the software will move on to the next frame.
- You can go back and edit points if you like. You can also decide to skip multiple frames in each click by changing the 'step size' at the bottom. This can be useful especially when things change slowly.
- Keep going until you went through all of the video / image sequence.
Second Method - Intensity Profile (GIF #2):
The previous method lacks some accuracy. 'The point where the dye is not longer visible' is not well defined, and depends on the person analyzing the data. A more robust way of analyzing the data is by looking at the intensity profile of the image. Brighter regions have higher intensity than darker regions. We can measure in Tracker as well.
- Add a new Track of a 'Line Profile' type.
- Use Shift to place it along the direction of the diffusion process.
- A window will open on the right side of the screen showing the intensity as a function of distance. Define a point in the intensity profile that you want to track. For example, 'the point where intensity is equal to 50'.
- Measure it's position over time. You'll need to write down the time and position of each point manually (you can write it into an Excel sheet). Students can do this in pairs to save time. I realize this can be time consuming if you go through all of the captured frames, but analyzing about 20-30 frames should be plenty! Adjust the 'step size' so you skip through more than one image at a time.
Third Method (GIF #3):
This method is basically an upgrade of the previous one. I wrote a python code that analyzes the data automatically. It runs through each image and measures the intensity profile along a selected region. It does a few extra things like removing the background noise and such. Also, I used a green dye so it analyzes the green channel of an RGB image, but you can make a small modification to the code to analyze other colors or all of them combined.
- Run the code and analyze your images.
- You'll end up with all of the intensity profiles. All that is left is to track a selected point along the profile. Say, 50 gray points above the background. Define a threshold that would work for your images.
- For each profile, calculate it's distance from the threshold, that is: abs(profile - threshold). The smallest value of this vector will be the point where the profile is equal to the intensity threshold you've chosen, so the easiest way to find it is by looking for: min(abs(profile - threshold). I've attached MATLAB code that does all of this, plots the profiles, and saves them as images.

Step 7: How Fast Are Things Moving??
Now that we have tracked the diffusion process over time, we can start the final part of the experiment. In this part we will try to answer questions about the rate at which diffusion occurs.
By looking at the images we've aquired we already have an intuitive feeling for it - diffusion starts off pretty fast, but then, as time passes, it slows down. My experiment was running for 48 hours, and the test tube was far from well mixed. The typical distance the dye I used propagated was about 1cm (less than 1/2"). This is very slow, and very typical for diffusion in water!
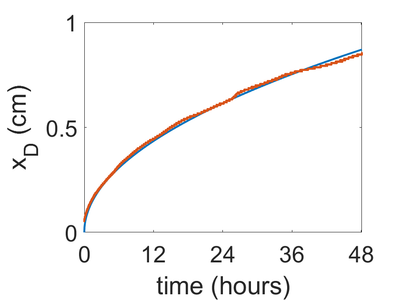
I made a GIF of the time dependence of the intensity profile for the first 48 hours of the experiment. We can see that the profile changes very rapidly at first, but then it slows down. This is what we see in the images too, so that's a good sign the analysis works :) I then defined the point where the front of the intensity profile reaches a value of 50 gray points above the background intensity, and marked it with an orange circle on each of the profiles (see third method in the previous step for details). I called this point 'x_D' (D for diffusion).
Finally, I plotted x_D as a function of time (see the graph I attached). x_D is shown with orange markers. There's also a blue line on the graph. This graph describes a theoretical fit to the data. Diffusion has a very precise physical formulation which matches reality to very high accuracy. It suggests that diffusion should occur at a rate that scales as the square root of time. In other words, x_D should scale as: x_D ~ sqrt(D * t), where 'D' is the diffusion coefficient of the dye in water and 't' is time. So, I tried to fit the x_D data to a function of the form x_D = sqrt(D * t). The fit is very good, so it seems that diffusion does scale as the square root of time, as expected! I could also use the fitted function to get an estimate for the diffusion coefficient, and found that it is of the order of 4 * 10^-6 [cm^2/sec]. This is very close to the real value of the dye I used (5.5 * 10^-6 [cm^2/sec]). This difference was expected since I could have defined x_D slightly differently and end up with other results. Measuring the exact diffusion coefficient takes a little more effort than what I did here, but for an estimate and order-of-magnitudes this is perfectly fine.
Step 8: Conclusions


We saw that x_D scales as x_D ~ sqrt(D * t). We can now ask, if we wanted for the dye to reach a point x_D away from the source of the dye, how long should we wait? This is answered by inverting the equation: t_D = (x_D ^2)/D. This seems mondane - nothing special, right? But this equaion dictates so much in biology and life. For example, have you ever wondered why cells are small? Why don't we see huge elephant-sized cells? One of the main reasons for that is that cells depend on diffusion to obtain nutrients. If cells were too big, diffusion would become inefficient. Using the diffusion coefficient we found, we see that diffusion will take about 40 minutes to pass just 1mm (1/25.4"), but it would take less than a second to pass a distance of 10 microns, a typical distance to travel when thinking about cells. For instance, when you exercise, your muscle cells need constant supply of oxygen. If the cells were too big (1mm sounds small, right?), diffusion would become inefficient and the oxygen supply wouldn't reach the inside of the cells fast enough. [the sizes-GIF was created base on Learn Genetics]
To conclude,
We saw that diffusion experiments need careful attention and a lot of patience. I found that the best way to demonstrate this phenomenon is by capturing a video. You can do that with the students if you want to take this into the class-room. Another option would be to initiate the experiment on one day and looking at the results the next day. You'll see the dye has started to mix into the water.
On large scales, diffusion takes a very long time (over a mm or 1/25.4 of an inch is already considered large!), but on very small scales, such as the sizes of cells (a few microns), diffusion is a very efficient way to move things around. This explains a lot about biological processes and other physical phenomena. I think that once you develop intuition for the process and its time-scales, you can appreciate so many things about the world around us.
I hope you found this topic as interesting as I find it! And if you're in the world of teaching, I hope you spread the word! There's a huge misconception about diffusion due to wrongful demonstrations, and it's our job to make things right :)
If you like my instructable and want to see more, you're welcome
to visit my instructables page and my website
By the way, if you want to support my projects - subscribing to my new YouTube channel is currently the best way to do that! :)
First Prize in the
Science Fair Challenge