Introduction: Cyclone Weather Station


This instructable is about a general Arduino + Raspberry PI based weather station design everyone can build on. It's unlikely that you will be able to buy the exact same weather station type. It's about you buy whatever broken second hand commercial station and you rebuild it and calibrate it based on this guide.
One of my first Arduino project was my Natalia Weather Station which although had it's "design issue" being built into a simple IP box and when the sun directly shined on the box of course didn't give accurate data but at least that was my first solar project which really managed to self sustain.
Over the years I have made an ESP32 version of it, which of course couldn't self sustain not even with sleep mode, then I started working on a HC12 long range weather station which would've been also solar powered and send the data 3-4km away to it's receiver. This project unfortunately also got scrapped.
After my Atmega 328P weather station reached its end of life, I have made a similar RPI2 based station with a weather cam built into a IP65 box, however I'm far from impressed from the PI's sensor polling capabilities vs a real MCU like the Arduino let alone it can't even do Analog.
These iterations eventually brought me back to my builds which work reliably over a long period of time (using the Arduino's sensor polling capabilities and complementing them with the Raspberry PI's processing power and IOT stack).
Supplies

BOM for the station:
- 1x Some broken/working weather station of your choice for casing (prefer rugged heat resistant case, full white, don't chose small case to have space to work with). All-in-one stations are NOT the best choices, you will find out why by the end of this tutorial but they are the most compacts for any homes, especially if you living in some flat with no garden then you have no choice.
- 1x Raspberry Pi Zero W 1-GHz, 1-core Broadcom BCM2835 (ARM1176JZF-S) 512MB 802.11n / Bluetooth 4.1 1x micro USB, 1x mini HDMI
- 1x Raspberry PI Camera v2.1 + optics + special connector cable (for the pi zero you will need a different cable between the cam and pi, make sure you buy the right one)
- 1x Atmega328P
- 1x 16Mhz crystal
- 4x LED + 4x 220 ohm resistors (blue, red, green, yellow)
- 2x 10k Ohm resistors (input pullups for the interrupt pins)
- 1x 4.7k Ohm (pullup for the whole i2c bus)
- 1x AHT20 (AM2301B - Wired Enclosed AHT20 - Temperature and Humidity Sensor)
- 1x BH1750 light intensity sensor
- 1x BME280 added as atmospheric pressure & altitude sensor (get the E not the P it can do humidity as well) this superseeds the old BME/P 180 series
- 1x RTL2838 usb dongle added for FlightRadar24 (optional)
- 1x HC12 for the station (optional in case you want m2m communication eg building the receiver indoor Arduino unit)
If you want to build the Arduino based client screen or the Relay Clients, you can find those in a separate sections.
Step 1: The Revival


This weather station is NON-SOLAR build. It is using a power hungry Raspberry PI (for iot, data logging, weather camera, flight radar) + Arduino for polling all the sensors. Solar powering it would be possible of course, if you decide to go that way make sure you way oversize both the panel and battery bank to be able to run just on batteries for 3 months and have fun with it. This build is also capable for long range transmission (kms) due to the HC12 but the Raspberry PI here meant to be used with wifi so this whole build is ideal for something just outside of your home running from a regular 5V power supply.
I decided that instead of going with what works (sensors I used many times like the DHT22) I going for the latest and greatest for some sensors and keep some of the old stuff. You can see the reasoning in the following chapters.
What can the station monitor:
- Temperature/Humidity
- Atmospheric pressure
- Wind speed
- Wind direction
- Light sensitivity
- Rain amount
What's new (compared to my earlier projects):
- DHT22 replaced with AHT20 (AM2301B - Wired Enclosed AHT20 - Temperature and Humidity Sensor)
- LDR replaced with BH1750 light intensity sensor
- BME280 added as atmospheric pressure & altitude sensor
- 433Mhz radio transmitter replaced with HC12
- Raspberry PI 2 replaced with Raspberry PI Zero W
- OS: Debian 11 (armhf) => replaced with Void Linux (aarch64)
- RTL2838 usb dongle added for FlightRadar
What's not new:
- Barebone Atmega 328P chip remained as the "brain of the station"
- The Arduino code is built upon the old Natalia Weather Station's code the output is similar just more columns
- The communication between the Arduino and Raspberry PI remained one way (Arduino -> pushes data periodically to the Raspberry PI)
- Zabbix remained as the data logging and plotting solution
Step 2: Problem With the Old Components

This is going to be a short topic about what is the issue with some of the old, replaced sensors.
DHT22
https://learn.adafruit.com/modern-replacements-for-dht11-dht22-sensors/why-are-they-probelmatic
TLDR: They are blocking the code (which I don't care). These sensors also tend to be just plain finicky. Even if the tight timing requirement can be met, sometimes the signal read cannot be decoded properly.
Temperature sensor comparisons
https://randomnerdtutorials.com/dht11-vs-dht22-vs-lm35-vs-ds18b20-vs-bme280-vs-bmp180/
https://www.raypcb.com/bmp280-vs-bme280/
LDR
This drains unnecessarily much power and it's far from precise, basically it was a voltage divider on an Analog pin in the old builds with one of it's resistor value (LDR) keep changing by the light. This was still good enough for sensing outdoor solar sensitivity and turning on some lights based on that inside the house.
Solar design
Although the Natalia Weather Station did work with low end fake components like the 6000mAh battery (which in reality does a 870mAh best) or bad quality solar panel, it did work because I went down to microAmps in sleep and some milliamps at the transmission. At the moment you introduce any Raspberry PI (any model) into this build you bringing in a power draining beast and I do guarantee you it does not worth neither your time, nor your money to try to solar power it unless you building it for long range standalone application (which doesn't make any sense either due to the wifi). If you building any weather stations near to your home just save yourself a lot of trouble, ditch solar.
Step 3: Hardware Design


I bought a second hand partially broken weather station (just for it's case). Just used the good old don't turn it on take it apart method right away because I did not want to torture myself with trying to interface with some proprietary circuitry and sensors neither do I need some small crappy solar panel in this build so I gutted the old one. Hence this is a generic build, I will not mention any weather station brand here, buying the exact same station is not recommended. First of all this isn't a 10/10 rugged heat resistant design but one of those cheap plastics, secondly the engineer who designed this weather station made a design flaw while trying to squeeze everything into the smallest place possible and making the rain gauge dump its water outflow directly on the chamber of the temperature sensor which most likely lead to the end of it. Thirdly the bottom of the station is black, what was the reasoning for this?! So when sun shines on it from the side it heats up the bottom part even more also effects the temperature readouts. This is something I might fixed a bit with a white paint. Some food for thought right there when choosing your station, don't buy a station with black parts in it.
From the old station I still wanted to reuse the anemometer, the wind direction sensor and the rain droplet counter. The later 2 was exactly what I expected when I opened up the case however the anemometer in this station is another simple reed switch with a spinning magnet, aka another impulse counter.
Anyway this should not discourage anyone to give up and try to replace the old one. It can be calibrated just as well, actually makes things even more simple. In this station you are dealing with 2 impulse counters (one for the rain gauge, one for the anemometer) and guess what the Atmega 328P has precisely two interrupts. This is explained later on why do we need to use interrupts for this two sensors instead of regular Analog pins, just keep this in mind that this is a limitation of the Atmega 328P if you need more interrupts for whatever reason then you need to use another Arduino like the Pro Micro, Mega etc.
I replaced the solar panel with the RPI camera, the lookout window come handy.
The 433Mhz transmitter was replaced with a modern digital radio HC12 due to the possible interference and short range. The HC12 supports over 100 different channels, 3 power modes, 4 different over the air baud rates it also comes in a size of plug & play USB stick. I would just note 1 thing here to avoid getting upset. For the programming mode you need to pull the SET pin to GND and at commands can be sent to the device for example AT+RB AT+RC. Make SURE that the device is powered off before you ground the pin (same with the USB stick, you must push the programmer button BEFORE you plug the device in) otherwise it will not go into programmer mode as soon as the programmer pin removed from the GND the device exits the programming mode and will NOT reenter only if the whole circuit is power cycled. In this setup since the data amount is tiny what we need to send and we would like the max distance we will use OTA 5000 baud which on the serial console will be 1200 bps and set it to Channel 12. It's a good practice not to leave it on the default as you might build other project in the future and they will be using channel 000 by default.
The same data passed down on the serial UART to the RPI for logging/processing.
There is no RTC of any kind in this station due to the PI will add the timing information.
Raspberry Pi Zero W is used due to 4 constrains:
- There isn't much space in the station
- Heat dissipation of this model even without heatsink on full load was way lower (about 52C on room temperature on 100% load) compared to other models 2/3/4
- It is just enough for the build, it is mostly used for datalogging, even the added flight radar software isn't much of a cpu hogger, except motion for the camera and that can be capped as well
- Wifi works reliably, I had this board with about a year uptime with one room with the AP (checks implemented see later)
It is a nice 5V build, the Arduino part and sensors are operating on 5V, there is a 3to5V TTL converter for communication between the PI and the Atmega328P.
One downside of this build is the PI Zero only has one real USB port (the other is just a power connector), you can throw the RTL sdr out of the project and it's problem solved for you. The reasoning behind not wanting to have a full programmable Arduino (like the ProMicro I use in many of my other builds) is simply that after this thing is calibrated, there is absolutely no reason for reprogramming the chip ever, the functionality is limited by the amount of sensors by the station. The worst thing can happen over the years is the chip fries and you program up a new one put it into the socket. Also regardless that I did not have a lot of problem with outdoor Arduinos, one single DIP package can take the harsh environmental effects more.
This is a fanless design, I just going to mention because even my RPI2 based station could take the highest summer temperatures just with a heatsink and adding a moving component inside a closed case can cause additional issues. In case you considering pumping cool air from the outside get ready for insane amount of dirt, bugs, rain and whatnot and your station will probably won't last a single month :) Nevertheless there are a plethora of how to add a fan to a raspberry PI mods out there so if you still want to you can add a fan. In this build neither the PI's temperature nor the cooling from the fan will interfere with the temperature sensor as its outside in it's own chamber.
Some final good advices for anyone building her/his own station:
- Hermetically seal the electronics if possible. In my case this was challenging due to the built in rain chamber in the middle of the station.
- Use rugged connectors or solder in the wires even if it makes repair harder because the station will be subject to constant vibration/resonation which will losen these connectors, the worst thing to do is trying to use the "standard" low quality Arduino jumper cables or anything like that.
- Just rewire the sensors with better quality cables. I love using trashed CAT5/6 Ethernet cables with twisted pairs due to these cables are easily available and high quality. Do not use RIGID cables anywhere in the station just cables using multiple soft copper wires as a core. The rigid ones don't play well with terminal strips and they can snap over time.
- Don't use the small coil antenna coming with the HC12s, they have sma connectors, get an external antenna and if it's possible move it away from all the electronics (possibly put it outside of the box), in some of my Arduino receivers I only use it because it works for me (small distance, no extra weight I can build the board SBC but having an external antenna will make all the difference in the world, especially if you aim to transmit to longer distances)
- Dealing with radios it's always good to field test the location for couple of weeks, both the Wifi and HC12.
- Test different sensors over the long run on breadboard before assembling the station (weeks)
- Think out of the box, if you can't interface with a sensor then just buy a commercial solution instead of wasting your time
Debugging facilities
You should build the station step by step and test everything step by step. I have introduced a couple of things which helps you debugging in both hw/sw:
- Four different color leds on the base stations board will help you (blue - tx indicator, red - error from any sensor, yellow - interrupt by the rain gauge, green - interrupt by the anemometer). All the LEDs will blink 3 times at bootup, this by itself is helping you determine if your Atmega 328P is ticking and running it's code or not.
- In case you build the Arduino receiver there is an F variable displayed on the LCD, this is extremely useful for debugging lost/corrupted radio transmissions, normally this counter gets increased in case of every radio transmission the receiver received but failed to decode, as soon as it receives one valid it is zeroed out. You can uncomment it to be zeroed using this as regression testing for the radio communication over days, weeks.
- To program and debug the HC12 (speed, channel) it is better using the separate serial relay code.
- To debug radio issues any further consider getting a regular PC USB HC12 dongle and having it side by side with your receiver so in case you see that the data coming in on the pc right but there is some issue on the Arduino side you know where to look (client)
- To debug serial issues between the Arduino <> PI (see more in the Raspberry PI section) the best is to use a separate Arduino like mega running the Serial Relay code (this code will take all input from Serial1 and copy it to your open serial connection and vice versa). Hook the mega up to the same power supply as your circuit (important for common ground) then use one single RX1 pin. Touch the pin to the Atmega328Ps TX, you should start getting the data from it, this should also work on the LV end (3.3V) so you can touch the read wire to the exact same pin (PI RX). If it's all good so far then the problem is related to the Raspberry PI see the software section.
Step 4: Software Design: Generic
As it was mentioned earlier I'm using a one way communication (not polling as with many of my other designs) between the Ardu->RPI (+ Ardu->Radio) to keep things simple. The Arduino is used for weather telemetry only. You could use it for a million other things like watering your flowers or whatnot of course but if you use one communication channel between the 2 and you getting back feedbacks for your commands like COMMAND_WEATHERBOX_OK that could interfere with the data stream. Always follow the KISS principle, keep things simple stupid and compartmentalize.
The data points being passed through serial (+air HC12) are:
>humidity, temperature , light, light_avg , atmospheric_pressure, wind_speed, wind_direction, rain<
Everything is floating point except the wind_direction is an unsigned integer between 0-15, 0 signaling the North going clockwise (East 4, South 8, West 12).
Sampling interval
This is maybe one of the most if not the most critical decision in the making of the station. You will understand later on when detailing different sensors why. The TLDR version is the lower you go down in granularity the more difficult things are going to be.
I have chosen one minute sampling (this does not apply for the interrupt based sensors will be explained later) because:
- The weather does not change that much in 1 minute
- Some sensors don't like to be polled constantly like in every seconds
- Your data points (whether that is a log file or a database) will increase dramatically, more disk space, more cpu power for plotting
- I do operate things on other machines from cron based on some of these telemetries and cron has the lowest granularity of 1 minute
- In case you use the HC12 radio part if you go lower than 5 seconds in granularity with the amount of data (reception speed will also depends on the distance, obstacles etc.) it is possible that before the previous transmission fully processed and the next receive loop begins your station will already receive the beginning of the next one leaving you with junk (for this you can increase the BPS from 1200 to 9600 and lower your range/reliability)
- There are some sensors which can average, there are some which must average because cannot work on any other way, for these you need to pick a base point on which you want to average at (on 1 minute, 5 minutes, 15 minutes, an hour, a day whatever ...)
Different sensors express errors on different ways (negative numbers, NaN - Not A Number) for this I have written a small code part which generalizes them into an error message 'E', this has the lowest overhead an in case of an error you want to take apart the station to debug it more anyway.
Unfortunately the sketch in debug mode uses 91% of the dynamic memory, really pushing towards the Atmega 328Ps upper limits. Without DEBUG it will use up 70% of the dynamic memory and will work just fine.

Step 5: Sensors: Temperature/Humidity/Atmospheric Pressure/Light Intensity
Let's very briefly go through the standard Arduino sensors (AM2301B, BME280, BH1750) there are a plethora of tutorials for them online and the source code of the station is available and well commented.
These sensors are fortunately I2Cs, they have their own hardcoded address on the bus they will not interfere with each other, they are really plug and play.
They all need one single pullup to VCC (not mandatory, it's for reliability) and that's pretty much the wiring part.
All these sensors are polled once per minute before the transmission then the data pushed out on radio and serial, end of story.
The light is the only special from this pack as it's also getting averaged per hour. This is the best way to turn on lights in your house at dawn, otherwise if the weather would be cloudy, just taking the regular light value could go above/under a certain threshold making all your lights turn on and off. The averaging for the light also happens on the same 1 minute basis. The reading is pushed into a 60 element float array, once the end of the array is reached the code starts filling it from the beginning making the perfect smoothing in value so the TLDR version: the light will slowly decrease at dawn and slowly increase at sunrise.
Step 6: Rain Gauge


Get started with the attached video to understand how it works.
Not to say that this code is flawless it's good for building on. You should never use Serial.print inside an ISR. Why? Because the serial.print uses interrupts on it's own.
Hardware wise the TLDR version is the gauge is a simple reed switch which is hooked up to one of the two interrupts of the Atmega 328P with a 10Kohm pullup to VCC. As I mentioned it in the code do not use the INT_PULLUP function of the Arduino, using an external pullup resistor is more reliable. Just like in case of dealing with reading inputs from any other switches we must take care of debounces.
I have calculated the exact amount of water which flips one cup with a medical syringe (rinse repeat this 5-10 times, make sure that your station is completely horizontal, as you notice this is what the little floating bubble serves on mine, if your station is off, gravity applies differently to the rain gauge inside) .
This isn't exactly mm:
When rain is measured in inches or millimeters, it doesn't matter if its measured in a bucket or a swimming pool. (assuming the object is same width at top and bottom)
But when measured in volume, the size will matter. A millimeter of rain in a bucket is less volume than a millimeter of rain in a swimming pool.
Anyway I leave reset of adjustment as an exercise for the reader, personally I like to use metrics I understand and I can imagine 1mL water, that make sense to me. You see the beauty of building your own weather station, everything can be exactly as you wish. If you want to display everything in binary, xenomorph, borg ... you can ;)
Software
This is where things start to get more complicated. Why? because an ISR can happen at any time. Serial.print will override the other interrupts (when it's sending the data out) but they most likely will be executed (if it would happen in the exact same time) afterwards so let's just stick with an ISR can happen at any given time.
So what do we care about here mL/second ? let's hope won't rain so much ever :-) mL/minute? even for that you would need to be living in some rainforest, let's settle on mL/hr.
Since this is a time based impulse counter there are a couple of ways you could go:
1, Take the reading at the time of data transmission. I just wrote this down for the sake of completeness just to demonstrate that this is completely stupid and undoable there is one in a million chance that the gauge would flip in the exact second of sampling
2, Let's improve on this by having an ISR which can execute any time (even in that 1 minute of sleep we are waiting for the next sampling from other sensors and the transmission), update a global variable rain_true or rain_false and when the wake up time comes send the rain amount if there was rain or send 0 if there was no rain. Now the problem with this as I just mentioned that in my area even with very heavy raining there might be one flip event in minutes which is 1.3mL for me so going this way basically would make a sequence in time like this: 0, 0, 0, 0, 1.3, 0. Not very useful.
3, Let's improve more on this again and let's fix the criteria (it might be different in your case?! using a smaller capacity gauge, living in a rainforest whatever) there can be only 1 single flip event per minute even in the worst raining conditions, that's a boolean right there it's either true or false end of story but you must remember it can happen ANY TIME during the minute. Let's introduce a simple tick based 3600 seconds hold timer at the beginning of the main loop. Each loop if the rain is true the rain amount will be cumulatively summed up into a rain variable, when the hold timer expires it simply zeroes out this variable so on a rainy day the readouts might look like this: 1.3, 1.3, 1.3, 1.3, 2.6, 2.6 ... end of the hour 26.0, after that 0.0 starts building up from here. This you can imagine will result in tooth spikes on a plotted graph in case of a constant rain. What is the problem with this? Nothing, except what is an hour? When is an hour start? The Arduino has no way of knowing that besides using the millis as a hold timer is good for many things but far from precise so even if you would start you station right at 12:00 it would start drifting in a couple of hours, a couple of days later it would be so drifted off the hour wouldn't make sense anymore. I know it from experience that using these cheapo DS timers are not much better either you constantly need to be reprogramming them for adjustments.
4, Let's perfect the previous point, in this case we have a dead precise timer synced with atomic clocks, that is the raspberry pi with NTP so the PI could provide exact timing data, if nothing else just send a 0 or 1 at the start of every hour back to the Atmega to signal the beginning of the hour and reset this variable. This is the only way you will get the precise rain amount per hour.
5, I will definitely go with point 4 when building my next station and would recommend everybody to also take that approach however I did only think of it after the station was completed and I did want to keep that one way comm between the Arduino -> RPI so let's discover an alternative timeless option which will just work. This can come handy for those who neither want a raspberry pi, nor any kind of time source. It is actually very simple and don't care about what time you start your station. In this case (just like in the previous 2 approaches) we will store it down in a variable if there was a rain or was no rain in a minute then based on that statement we take a 60 element zeroed out float array and start adding the numbers into the array, after each number we move with +1 position, when we reach the end of the array we will jump back to the beginning. Important to note that if there is no rain then 0 will be still pushed to the array. Unlike the wind, all the elements of the array after this are summarized and this is the data which will be sent as telemetry both on console and on radio. This is basically a smoothing method and it does not care about the concept of time. What will happen when the rain increases that more and more 0 slots will be filled up with 1.3 in case resulting something like previously : 1.3, 0, 1.3, 0 1.3, 1.3 ... end of the hour. Let's assume it stops raining now instead of zeroing this variable, more and more 0's will be added to the array which will override other values this reading will slowly decrease to zero creating small mounds on the charts or consistency in case it keeps raining.
Step 7: Sensors: Wind Speed Sensor (Anemometer)


How anemometers work is well explained in the attached video.
The anemometer was nothing more in the original station than a spinning magnet and a reed switch. It's magnetized on a way that it turns on the reed switch twice per revolution (if you build your own station and you come across similar setup you can easily debug this with an LED).
My code is based on this with 5 major modifications:
- Wind speed alert was removed and instead a signaling LED added (this is useful for troubleshooting later on)
- The float getWindMPH(float freq) { return (freq*0.1); } adjusted to get a proper reading for my anemometer
- Unfortunately as others noted this code produces 0 Hz and 0 mPh many times while the anemometer is constantly spinning. I had this issue with even his unmodified code, mine using a bit different logic to begin with. This is useless for us that a wind is 20 Kmh in a second then in the next one drops to zero. Why it's hard to say can be some issue with the Arduino's interrupt handling, we dealing with a couple $ worth of hobbyist chip here not an industrial computer, I don't know but we are all makers here and for this just like for everything else there are workarounds (let's sweep it under the rug). One workaround I can see is create a false positive reading detection eg: the readout is 100 Hz and it suddenly drops to 0 ... so if it drops with more than 20 let's say then do nothing (keep the current value and transmit that at least until a certain amount of rounds then take it anyway).
- detachInterrupt was removed, this caused some issues for me and Serial.print will do it automatically anyway (Serial events in the production version only happen once per minute)
- I calculate the average differently so the avgWindCount was removed
My solution was to migrate the smoothing function from another of my project (EOL), it comes handy for exactly these situations. How does this work?
Basically it is a float array with [60] elements. This array is initialized with 60x[0.00] s at start. Why 60? As I mentioned it multiple places of this guide the sampling interval of this station is 60 seconds aka 1 minute. If you add 1 element to an array of 60 elements in every minute and calculate the average of those once per minute that becomes an hourly average hence this is km/h.
Every case an interrupt happens (this is important to understand not just at the beginning of a loop but any time) the pulseTime variable will be updated however this will only be used for any kind of calculations once per minute when the calculate_wind() function is called from the main loop.
When the calculate_wind() function is called, the elements will be added to the array and divided by the number of elements aka you will get an average value. Once the end of the array is reached the program will automatically keep pushing in the new numbers to the beginning of the array (don't forget that just because we jumped to the beginning all the old values are still in it and counting).
When the wind stops and we start to get zero readings this will result more and more [0] s getting into the array therefore the overall average will decrease down until the point when it hits zero.
This way even if we get some false positives (zero readouts from the anemometer) here and there, they won't be significant. One thing important to note regarding the anemometer, this thing generates an insane amount of interrupts compared to the rain gauge, if I would have the smoothing inside the ISR (like the rain gauge) then that average would be based on what? Based on nothing, that would be more like a hardware random number generator :D Why does this work for the rain again? Because there can be one single interrupt per minute, it can happen any time but there can be only one, with this thing there can be like 52143 interrupts while spinning.
You can get a stopwatch generate constant wind and count with how many readings your system will be reaching it's real value. It is always a tradeoff if you make the array too big then it can take tens of minutes or more until the average will reflect the real value, however if you lower your array to too few elements then it defeats the purpose due to the false positives (false zeros in there). We also have a limiting factor here unfortunately and that is the memory of the Atmega 328P, you cannot make really large arrays with this chip because it doesn't have enough memory to allocate them. If this is important for you just chose another Arduino model such as the Arduino MEGA.
There are generally 3 ways to calibrate this:
1, Buy a 10$ instrument which measures wind speed and use that as reference
2, If the weather station what you have bought is still working or at least the part measuring the wind you create a test setup with an adjustable fan, write down wind speeds
5km/h - write down fan setting (rpm/voltage)
10km/h - write down fan setting (rpm/voltage)
15km/h - write down fan setting (rpm/voltage)
...
Now reproduce the same thing and check your readouts and either come up with a formula or just hardcode them
3, Do the test with hanging the anemometer out from a car's window and use the km/h as a base (I would rather not)
Step 8: Sensors: Wind Direction Sensor


There are multiple ways of implementing this:
1, With potentiometer:
https://www.instructables.com/Arduino-Weather-Station-Part2/
The problem with this is the mechanical failure over time and fail it certainly will ... those pots even get rekt with just regular causal usage let alone you want to use it for something like this.
2, Using an optical encoder (similar as in old mouses), attach the wheel to the wind gauge and unlike in traditional mouses you make a custom encoder wheel which will open multiple holes for the light to pass through depending on the position. Eg. north 1 hole open, 1 sensor connected, east 2 holes open 2 sensors are connected.
3, Using multiple mechanical connections and maybe some multiplexer (eg: you want to do 16 wind directions there are 16 connectors but you don't want to use so many inputs from the Arduino you multiplex them) anyway not recommended again because it's mechanical and it will fail.
4, Hall Sensors
Now this is what my station used by default and seems to be a smartest way! In mine there were 2 hall effect sensors labeled as SIP-3, what sip3 is well no1 can tell certainly but according to the datasheet what I found this might be:
The AH3368Q is an AECQ100 qualified high voltage low sensitivity
Hall Effect Unipolar switch IC designed for position and proximity
sensing in automotive applications such as in seat and seatbelt
buckle, steering lock/immobilisation, gear stick, transmission actuator
and gear position, HVAC compression, wiper, door/trunk closure, etc.
To support wide range of demanding applications, the design has
been optimized to operate over the supply range of 3.0V to 28V.
What was strange for me (as it would be for anybody else in IT immediately) is how does this thing can differentiate between 16 wind directions with 2 digital sensors?! According to this hall effect sensors data sheet if it reaches a magnetic threshold (B) the output goes into ON stage otherwise it's off so basically consider this as 2 switches. How many states can you describe with 2 switches? four: 00, 01, 10, 11 that's it so there is no other logical explanation here but this was analog.
I hooked up a mega with dedicating two analogpins to do analogread on them and it started to make sense already.
From the picture it shows the top reading (left hall sensor from top view) and bottom reading (right hall sensor from top view).
You can see from the readouts that while the magnetic field increases on one sensor it decreases on the other one and there is a correlation between the two. No exact values can be used but you can allocate small 20mV belts on both hall sensors and say that if we are in voltage belt 3.0-2.8V on sensor A and 3.10-3.18V on sensor B then the direction is North. You can notice that on mine this magnetization had absolutely no logic towards the declared North(it does not matter in this case we decide what North is). With my instrument the readings were equal 2V - 2V on both halls when the gauge faced the South.
Do not use USB powered Arduino for these calculations.
This take me off for a ride, after the circuit was assembled with the final Atmega 328P all the readings were way off. For this the best solution is just to enable DEBUG mode in my sketch, put the station together and power it from the same power supply you going to be powering it from for the highest accuracy then you can determine the initial L/R sensor values by moving the wind gauge.
If you encounter a setup like this and you can interface with the hall sensors the same way these are the steps to calibrate yours:
1, Decide upon how many directions you want to differentiate between, just like everything else in this custom design, it is your decision, I picked 16 directions as the original station did
2, Set the device in the front of you on it's pole facing the marked NORTH direction (does not matter where the actual North is for this calibration)
3, Do not try to push the gauge UPWARDS, either move it slightly with a pen, screw driver, fingers or with some tool you can support it from moving. Let it free fall, pushing it upwards with your fingers will change the magnetic readings!
4, On a paper note down the wind directions and for each the Left/Right readouts
5, If possible repeat this step 2-3 times for additional accuracy
Now if you see absolutely no consistency or the readings are changing then better give up already and look for some ready made solution. In case you do you just defined the edge points for the wind directions, in between them there will be voltage belts from which some might overlaps. For example if you look at my code (what will definitely not work with your device and you MUST adjust it) you will notice that going clock wise from North to wards East the RIGHT hall sensor will give a similar value (the range is there for possible fluctuations and errors) 3.20-3.47 while the LEFT sensor will be the dominant to determine the direction. After passing South you will notice a similar phenomena. So if you are still in the game here is how to proceed from here:
6, After you have some basic logic just use the example code in this section to print out the values and slowly turn the wind gauge around, once your range will not match you will get return 20 signaling an ERROR, otherwise a number in between 0-15. You look at which if conditions do the numbers correspond the most to find the invalid state, you have to make some compromises to adjust the range to work. You can rinse repeat this slowly a couple of times to finish the calibration. I have chosen this numbering schema because it will help us a lot with the LED display on the Client receiver which will just ignore the error condition (not update the wind direction) whilst it will show up on the Zabbix charts as it should.
At the end your code should return distinct 0-15 based on the direction when moving the wind gauge around, there should be no errors, no duplicates.
Normally the original station would needed to be mounted facing North with no possibility in software to change the angle, with this being our own code it's not an issue of course. All you need to do on the clients to compensate for the drift.
https://www.electronicshub.org/hall-effect-sensor-with-arduino/
Step 9: Raspberry PI: Generic

The data is pushed periodically from the Arduino to the PI through the hardware UART (serial). For this I using a custom C code to get the data from serial, log it to a file and also provide the latest data for query on a TELNET port by any external clients (this is a multiclient socket server so multiple devices can connect the same time on telnet and get the weather data).
I often use ser2net for similar Arduino => RPI communication scenarios however that tool is only good when the PI sends a command and expects a response from the Arduino (Query) not when constant downstream data comes in unknown time periods.
Once again I have chosen Void Linux as operating system due to it's clean system(d) free design and fast package manager. The deciding factor not to use BSD was that the wifi doesn't work on the Pi Zero W also the camera support is more than poor. You can't have your cake and eat it too. Going into the void is going on the hard way in case of raspberry, you won't enjoy raspi-config but manually edit config.txt, for resizing the partition you have to use another computer and an external tool like gparted.
I don't know why but when it comes to serial communication it never goes smoothly :) so here is how to set things up methodically:
First of all enable the serial console in /boot/config.txt (there is no raspi-config in void you have to do it manually)
 # Enable serial console
 enable_uart=1
Make sure that the OS does not try to start a system console on the serial line, look into /boot/cmdline.txt if it contains any ttyAMA0 ttyS0 remove those, it should look like:
root=/dev/mmcblk0p2 rw rootwait console=tty1 smsc95xx.turbo_mode=N dwc_otg.lpm_enable=0 loglevel=4 elevator=noop
Regardless that it was mentioned in the previous deploy section, you need to install wiringpi.
After reboot GPIO readall should show you this:
 +-----+-----+---------+------+---+-Pi ZeroW-+---+------+---------+-----+-----+
 | BCM | wPi |  Name | Mode | V | Physical | V | Mode | Name   | wPi | BCM |
 +-----+-----+---------+------+---+----++----+---+------+---------+-----+-----+
 |    |    |   3.3v |     |  | 1 || 2 |  |     | 5v     |    |    |
 |  2 |  8 |  SDA.1 |  IN | 1 | 3 || 4 |  |     | 5v     |    |    |
 |  3 |  9 |  SCL.1 |  IN | 1 | 5 || 6 |  |     | 0v     |    |    |
 |  4 |  7 | GPIO. 7 |  IN | 1 | 7 || 8 | 1 | ALT5 | TxD    | 15 | 14 |
 |    |    |     0v |     |  | 9 || 10 | 1 | ALT5 | RxD    | 16 | 15 |
 | 17 |  0 | GPIO. 0 |  IN | 0 | 11 || 12 | 0 | IN  | GPIO. 1 | 1  | 18 |
 | 27 |  2 | GPIO. 2 |  IN | 0 | 13 || 14 |  |     | 0v     |    |    |
 | 22 |  3 | GPIO. 3 |  IN | 0 | 15 || 16 | 0 | IN  | GPIO. 4 | 4  | 23 |
 |    |    |   3.3v |     |  | 17 || 18 | 0 | IN  | GPIO. 5 | 5  | 24 |
 | 10 | 12 |   MOSI |  IN | 0 | 19 || 20 |  |     | 0v     |    |    |
 |  9 | 13 |   MISO |  IN | 0 | 21 || 22 | 0 | IN  | GPIO. 6 | 6  | 25 |
 | 11 | 14 |   SCLK |  IN | 0 | 23 || 24 | 1 | IN  | CE0    | 10 | 8  |
 |    |    |     0v |     |  | 25 || 26 | 1 | IN  | CE1    | 11 | 7  |
 |  0 | 30 |  SDA.0 |  IN | 1 | 27 || 28 | 1 | IN  | SCL.0  | 31 | 1  |
 |  5 | 21 | GPIO.21 |  IN | 1 | 29 || 30 |  |     | 0v     |    |    |
 |  6 | 22 | GPIO.22 |  IN | 1 | 31 || 32 | 0 | IN  | GPIO.26 | 26 | 12 |
 | 13 | 23 | GPIO.23 |  IN | 0 | 33 || 34 |  |     | 0v     |    |    |
 | 19 | 24 | GPIO.24 |  IN | 0 | 35 || 36 | 0 | IN  | GPIO.27 | 27 | 16 |
 | 26 | 25 | GPIO.25 |  IN | 0 | 37 || 38 | 0 | IN  | GPIO.28 | 28 | 20 |
 |    |    |     0v |     |  | 39 || 40 | 0 | IN  | GPIO.29 | 29 | 21 |
 +-----+-----+---------+------+---+----++----+---+------+---------+-----+-----+
 | BCM | wPi |  Name | Mode | V | Physical | V | Mode | Name   | wPi | BCM |
 +-----+-----+---------+------+---+-Pi ZeroW-+---+------+---------+-----+-----+
Pay attention to wPI 15,16 from the table.
Although the explanations are here:
https://pinout.xyz/pinout/pin10_gpio15#
It's not clear why we can't use /dev/ttyAMA0 with ALT0 with the raspberry pi zero w (this is not the zero W 2). I mention this because it's different for the different PIs and in the future versions even the bluetooth can eat up the serial console. Anyway with the basic settings in mode ALT5 the serial console will be available on /dev/ttyS0 9600-8-N-1. If you having issues first do the hardware troubleshooting as it's described in that section, if that's fine it must be a software issue and unless you messed up the TX Ardu to RX PI wiring it's most likely going to be an issue that your port not enabled, eaten up by the bt or it's not in the proper ALT mode.
Here is a cheap trick how to change the mode from /etc/rc.local (this is not needed if you are following this guide and using the exact same PI, just here for completeness).
#gpio mode 15 ALT0; gpio mode 16 ALT0
If you want something with no timing data and extremely ugly and hacky just do:
 screen /dev/ttyUSB0 1200 (to initialize the port first then kill this)
 cat /dev/ttyUSB0 > /var/log/lamestation.log
The watchdog which does not watch over you
Due to operating the pi in extreme conditions we need to create some safeguards.
Regardless that I have built hardware watchdogs, this script I attached will do a thousand times better job than the original watchdog package coming with the operating system. Run this on your pi from crom every minute.
It checks the 5/10/15 minute load averages, it checks if there is less than 50 processes (this includes kernel processes, yes if it can't even get that the system is really crapped), it takes a snapshot of the current date time writes it out to a temp file and reads it back and compares the two, no this won't hurt class 10 sdcards anymore), it checks if the available memory is less than 10 mbytes, it pings localhost, it tries to ping the default gateway (this is the only intrusive option you must tune this if you plan on rebooting/upgrading your router often eg increase it to 3+ fail) if any of these don't check out then it will log the event, sync the disks then do a softreset as you would get with the magic SysRQ keys+B. Alternatively you can use the default normal reboot command.
End result: A nice clean OS.
runit---runsvdir-+-runsv---run---zabbix_agentd---4*[zabbix_agentd]
                |-runsv---runsvdir-+-runsv---run---dump1090---2*[{dump1090}]
                |                 `-runsv---run---fr24feed---16*[{fr24feed}]
                |-runsv---rsyslogd---4*[{rsyslogd}]
                |-runsv---udevd
                |-runsv---wpa_supplicant
                |-runsv-+-run
                |      `-vnstatd
                |-runsv---chronyd
                |-runsv---runsvdir---runsv---run-+-ffmpeg
                |                               `-streameye---{streameye}
                |-runsv---dhcpcd
                |-runsv-+-cronie-crond
                |      `-vlogger
                `-runsv---runsvdir---runsv---run---weather---2*[{weather}]
If you take a look at the example plotted Zabbix weather data you can see that it works perfectly as it should. Coming out of a post-rainy night the humidity drops while temperature rises. There is no wind until 9 then the wind and the wind direction starts going wild. Atmospheric pressure staying steady indicating that there won't be more rain. Maybe from all the best demonstration is the SUN light intensity and the averaging. It clearly shows that the clouds broken off and sun shine directly on the station around 11:00 and 14:30 but it will not skyrocket the light_avg value due to the smoothing, it's still a cloudy day.
Step 10: Raspberry PI: Camera
Instead of using motion which is a cpu hogger (as it would try to detect motion locally on the RPI) we will be streaming MJPEG from hardware directly and use a small utility to make that available on the web (for external camera aggregators like MotionEYE or iSPY)
 xbps-install -y ffmpeg
 git clone https://github.com/ccrisan/streameye.git
 cd streameye
 make
 make install
streamEye is a simple MJPEG streamer for Linux. It acts as an HTTP server and is capable of serving multiple simultaneous clients.
It will feed the JPEGs read at input to all connected clients, in a MJPEG stream. The JPEG frames at input may be delimited by a given separator. In the absence of a separator, streamEye will autodetect all JPEG frames.
Run ffmpeg to return a list of output resolutions your camera supports in the mjpeg format:
ffmpeg -f v4l2 -list_formats compressed -i /dev/video0
From this we will see that it supports a plethora of different resolutions:
[video4linux2,v4l2 @ 0x1d71340] Compressed: mjpeg : Motion-JPEG : {32-3280, 2}x{32-2464, 2}
Rule of the thumb is the larger resolution you chose the more traffic it will generate, eg just a 640x480 stream will result a constant 5mb/s outgoing traffic stream, you can play around with it to see just what resolution you really need and what bandwidth you can afford.
To run the streaming:
ffmpeg -input_format mjpeg -video_size 640x480 -i /dev/video0 -c copy -f mjpeg - | ./streameye -p 8081
To check in real time just do:
vnstat -i wlan0 -l -m
Streameye will be using around 30% CPU and FFMPEG 2% that's still something I can live with and heaps better than motion would be.
I would note 2 more tips for the camera:
- Using the night vision camera (NOIR version) doesn't make much sense that night vision will not see anything farther than 1-2 meters from the camera so especially if your cam looking at the sky this feature makes zero sense and the image of these cameras are worse than the regular ones, you might run issue with color saturation, red image, white image and other crap when using the camera outdoors just avoid the noir cameras
- Since the data traffic, depending on your resolution can be quite significant you can take advantage of the station detecting light using the light_avg value and simply turn off the camera at nights (for me even this way with using 640x480 resolution the camera, produces between 23-35GB data per day which of about 500mb is just TCP ACK packets). Unfortunately this is the downside of RAW video streaming, if saving with bandwidth crucial for you then just consider using motion for local video processing.
Step 11: Raspberry PI: Radar


Why would you build a flight radar monitoring aircraft positions into the weather station? Why not :D
Well it's optional and the pi is more than equipped to do this task next to the weathercam and weather telemetry. I used to monitor flights with an almost self contained system using dump1090 + Virtual Radar, with the project development not being too active I was looking for other solutions. There are 2 big flight tracker projects Flightradar and Flightaware which both offers you free business subscriptions if you feed data into their systems and take all the load off your hardware as it's nothing more than a dumb receiver which pushes some data points. Just register on their site to get your API key.
I not going into details how it works because there are many articles about the ADS-b transmission, the TLDR version is: dump1090 with the Realtek dongle collects aircraft signals (it's a special version which was made to work together with flightradar), fr24feed connects to this, collects the data and pushes it to their servers. All you need to do is create a radar user and make two services for these.
Flightradar config /etc/fr24feed.ini
receiver="avr-tcp"
fr24key="<YOUR KEY>"
host="127.0.0.1:30002"
bs="no"
raw="no"
logmode="1"
logpath="/var/log/fr24feed"
mlat="no"
mlat-without-gps="no"
~/service/flightradar/run
#!/bin/sh
/home/radar/fr24feed
~/service/dump1090/run
#!/bin/sh
/home/radar/dump1090 --quiet --enable-agc --metric --aggressive --net --net-http-port 8080
Pro tip for the connection to avoid similar errors (and possible interruptions):
4T18:36:26+02:00 cyclone kernel: [2166700.395350] ERROR::dwc_otg_hcd_urb_enqueue:501: Not connected
As you will notice on some of the base station's pictures I have reused a simple female to male cable, cut it, resoldered it for the other end to be a microusb male. These connectors can be quite flaky at least from the dongle's side due to the constant resonation so for an increased reliability I suggest to solder the microusb cable directly into the RTL dongle.
Step 12: Arduino Client (Receiver)


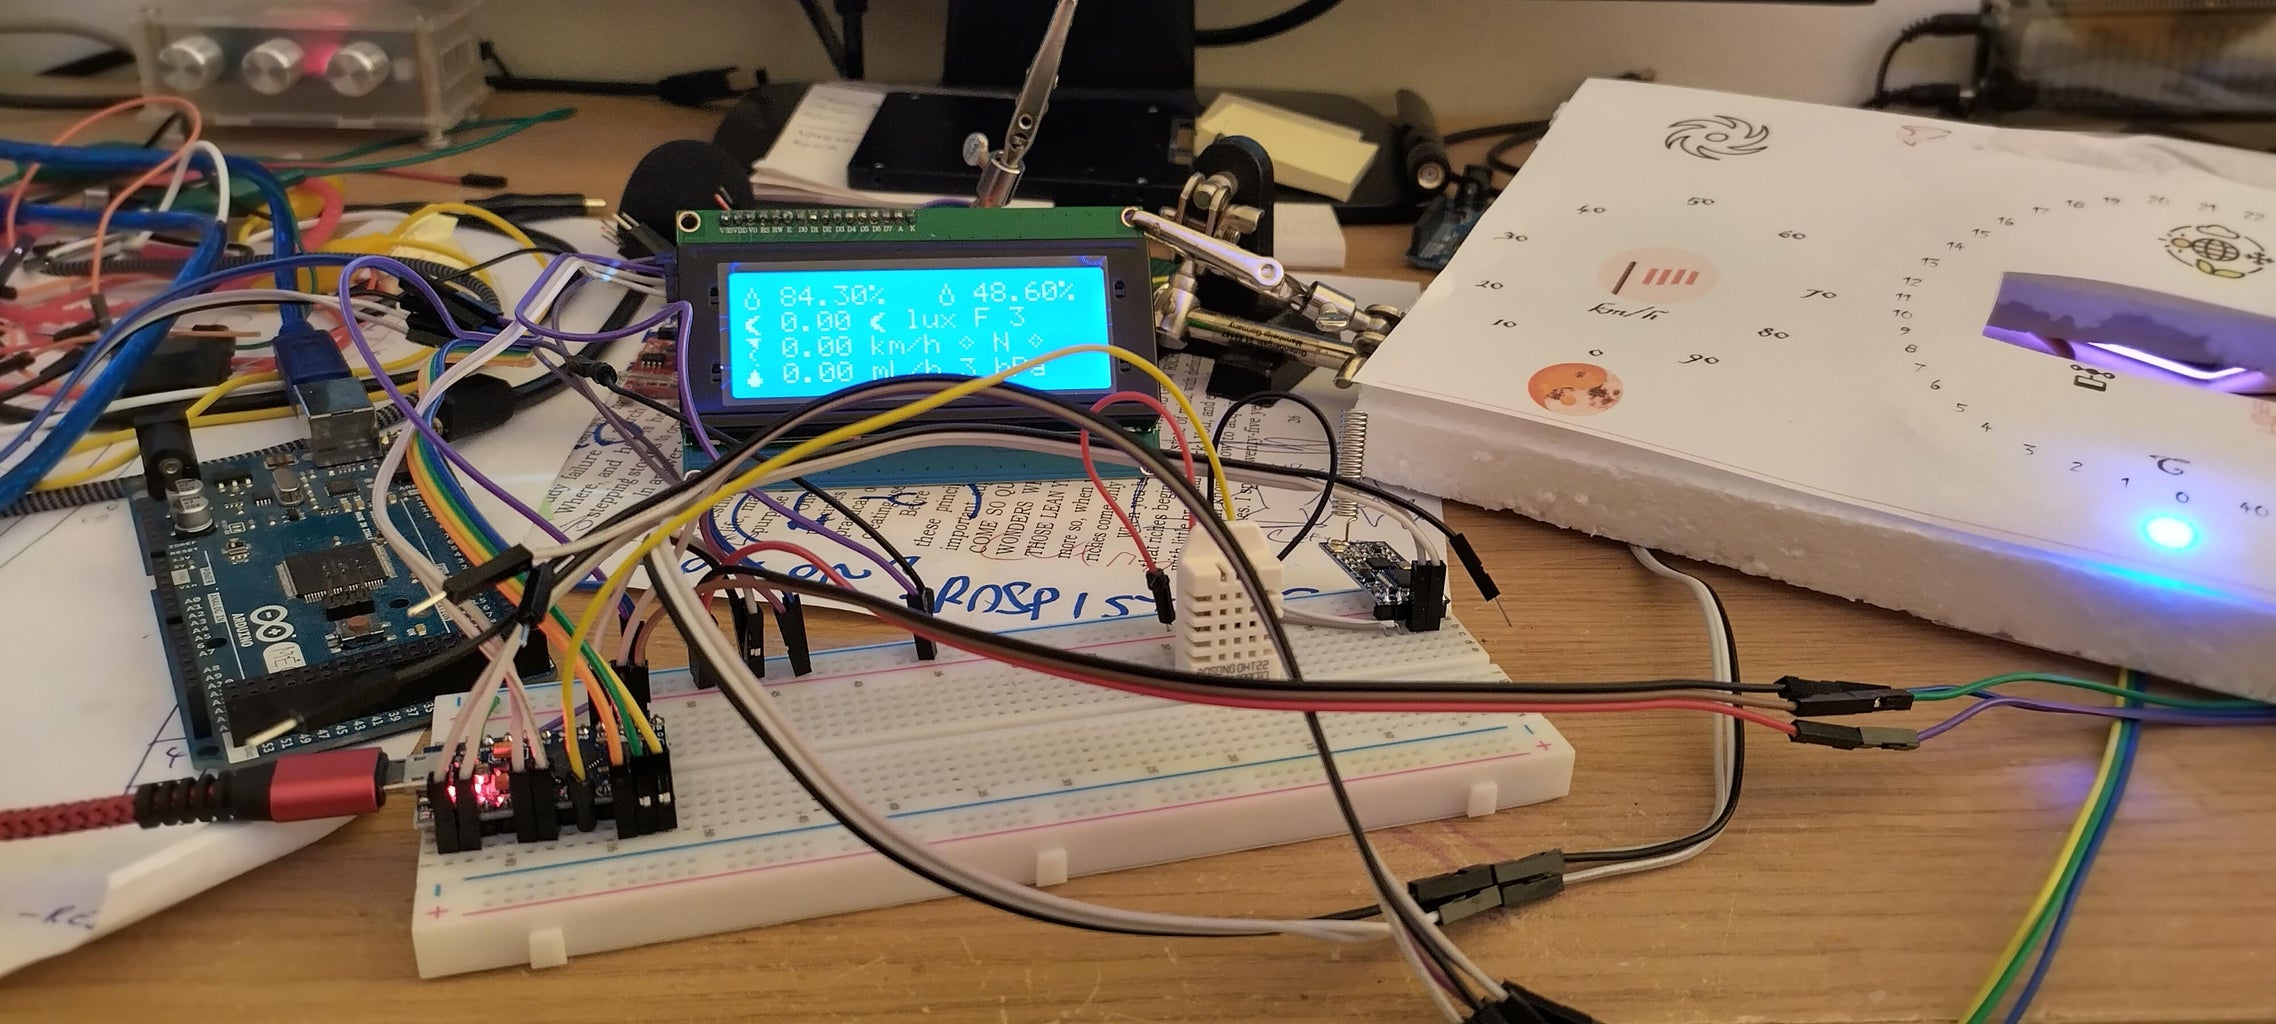


The client is optional since you have all the data available IOT you can feed it into the monitoring system of your choice and use some kiosk to display the graphs however I wanted to have a stylish display inside my home displaying not just the outside but also the inside weather data.
For the client I'm using my favorite Arduino Promicro (5V). For the LCD I using the I2C version to save with pins. The i2c version of the display library is almost the same as the original.
Bom with pincount eatup:
- Polystyrene Foam Sheet
- Paper glue, stick
- Color printer
- Double sided transparent tape (glue)
- Arduino Promicro 5V
- 1x HD44780 LCD Blue Display 4x20
- 1x HC12 radio module [2p]
- 1x MAX7219 Segment 8 Bit Digital Tube LED Display Module for Arduino MCU
- 1x WS2812B (5V) Neopixel ledring (40 LED) [1p]
- 2x WS2812B (5V) Neopixel ledring (16 LED) [2p]
- 1x prototype board pcb
- 1x DHT22
- 1x 10k pullup for DHT data pin
- 1x Terminal strips for power input
Client LCD display simulation:
....................
Hout 80 % Hin 24 %
S.1096.AVG.2996.....
W.38.km/h.Dir.NW....
R.20 mm/h.B.1096.hPa
There is not much to this circuit, the DHT22, LCD, HC12 are connected to the Arduino. For the HC12 I recommend at multiple parts of this writing to avoid using the small crappy coil antenna and just spend some extra bucks on getting an external antenna cable and kit but in this case I wanted to keep the receiver light in weight and after doing some transmission tests the failure rate was still acceptable.
From all materials I decided to make this from foam because it's extremely easy to work with long standing and easy to redo it from scratch in case you make some mistakes. I cut out a large T shaped gap in the middle for the LCD screen a 7segment display. I did some cool looking trick after realizing that 7segment is strong enough to clearly illuminate through paper so the top paper cover is left in front of it you just have to make sure it's touching the paper otherwise it will get blurry. For this I used double sided transparent tape at assembly.
For the led rings i made some shallow holes with screwdriver and punctuated it through at the connectors (at LED 1) then the final cover paper was placed over it with regular paper glue. I would note that you should experiment with glues before starting because some will destroy the foam. For me the regular cheap stick paper glue worked fine.
I'm sharing the base template and you are free to take my work but no way on earth you allowed to take someones copyrighted jPeGs :D so just find yourself some on Google to make your station unique looking. I actually just realized how many weather stations have unique designs and weather symbols on them because the creators wanted to customize them.
I used SmartDraw for making the front printed cover, in case you are interested about the fonts used:
Title: Kristen ITC
Wind speed, wind direction rings: Blackadder ITC
Mid dial numbers: Chiller
If you build the station with the same dimensions, after you placed your icons on your template and did some alignment tests just delete out all of the guide lines from it and print it. The only thing needed to be cut out is the small rectangle for the LCD screen, everything else will shine through the paper.
Compared to the Natweather 1 receiver I have added 2 more useful debugging features. The transmission is sent out beginning with > and ending with <, these will have to be there otherwise the message will be flagged as invalid and the data onscreen won't be updated by the client. Also the data columns separated with , will be counted and unless the number is what its defined in the code it will be invalidated as well. In case of a broken packet the station will blink all LED rings red 3 times then set it back to their state as they were.
There is no re-transmission code on either side so basically this is an unreliable transfer like UDP. I wanted to keep this design simple (KISS) and implementing an ACK system would complicate things a lot with multiple receivers. If the message is lost or corrupted the data won't be updated that's the end of it.
If WAITONBOOT is set, at start the client will display INIT as long as it receives it's first valid data packet from the base which can be processed.
LED Rings
For the main ring I have chosen a 40 LED standard WS2812B because this diameter perfectly surrounds the 10 cm long LCD screen.
This central ring is responsible for displaying the outside temperature.
With 40 leds it can go up to +40C (which might be a world record here) or go down to -40C (which won't happen). I learned from my previous experience with these rings from Ironforge, if you don't want to waste your time with them with adjusting back and forth just position them right from the beginning. For my ring the zero (start) and led 40 (end) is the bottom. Color wise I set the ring to start off with blue going into green, orange, yellow and ending in red. If the temperature goes under zero the code simply going to subtracts whatever number it is from 40 this way going counter clock wise. For example at -5C it will light up all LEDs from 40 to 35. In this case a different color palette is used to display the winter temperatures, continuing from the blue going into cyan and ending with clear white.
The two smaller 16 led rings are dedicated to the wind, the left shows the wind speed, the right the wind direction (of which 16 is perfect because the system can differentiate between 16 states).
Dealing with transmission errors and error correction.
This chapter is really just for the radio because it won't happen over serial. So here is an example for broken telemetry data due to corruption of the radio packets:
>7.90,NAN,525.83,3.15<
>7.70>7.70,NAN,476.>7.70,NAN,466.67,3.15<
>7.70>7.70>7.70>7.70>7.80,NAN>7.70>7.70>7.70>7.80>7.70>7.80,NAN,360.83,3.15<
>7.70,NAN,345.83,3.15<
There is a serious issue here. It is not just that the receiver gets junk data but it doesn't get the end of the transmission the \n which will allow HC12_Complete to be true and proceed so the execution will be hanging. The next transmission is due in 1 minute so your code will be hanging for 1 minute and if the next one is junk as well without ending that will add +1 minute waiting. For this a timeout value could' be added I will leave it as an exercise for the reader.
What my code does is eventually when the \n reached it does a strict input validation in this order on the char buffer:
1, It have to contain one and only one > and one and only one <
2, It have to contain 8 field separators , (8 separate fields)
3, It can only contain the following characters [0-9E.,<>]
In the final base station I have went through the trouble to intentionally break sensor readings to see how they react (it's explained in that code), if there is an error the transmission will still be pushed out but all the error fields are standardized to E.
Only after all the 3 checks pass will the transmission even be decoded any further in other cases the error_led will be called which will blink the dials red 3 times then does absolutely nothing, all the data remain the same, nothing will be overwritten with junk. However if any field is E (Error) after it blinks the dials it will display the data on the LCD to help debugging. The E fields will be displayed on the LCD / 7 segment displays as they should be.

Step 13: Arduino Relay Client (Receiver)


The relay clients are made for turning on lights on different parts of your home (night light), they all receive their information from the base station just like the client but ignore every field except the light_avg and make a decision based on that whether to turn on or off lights in the area. Why is this cool compared to a simple timer plug? This will work the same during the whole year regardless of what daylight period will the sun be providing in the given month, even better because on complete dark rainy days it will turn the lights on in your home as it should.
The range of HC12 is excellent but I strongly advise using an external antenna (placed outside of the box) to avoid data corruption/packet loss.
This is an extremely simple circuit, I won't provide any diagrams. If you using the barebone Atmega 328P chip base your sketch on the station, if you using any off the shelf Arduinos, basically you have to connect a relay, a HC12 (which can go to Serial1 on many which have 2 serials, don't even need to bother with software serial), 1 relay and some leds for debugging, that's it.
Bom:
- 1x 5V 1 channel relay
- 1x Atmega328P
- 1x 16Mhz crystal
- 3x LED + 3x 220 ohm resistors (blue, red, yellow)
- 1x PIR sensor (optional)
- 1x HC12
- 1x external antenna for HC12 (optional recommended)
I have introduced PIR sensors to this build for motion detection, it's optional you can turn it on/off in the code with MOTION.
Attachments
Step 14: Weather Underground Integration

I'm a big fan of WU because they provided me fairly accurate telemetry in the past 8 years.
Unfortunately they did not make their API user friendly for makers. The first clue I found about their API and most recent as well was this snippet: https://github.com/leoherzog/WundergroundStationForwarder/blob/main/code.gs
let request = 'https://rtupdate.wunderground.com/weatherstation/updateweatherstation.php';
  request += '?ID=' + wundergroundStationId;
  request += '&PASSWORD=' + wundergroundStationKey;
  request += '&dateutc=' + encodeURIComponent(Utilities.formatDate(new Date(conditions.time), 'UTC', 'yyyy-MM-dd HH:mm:ss'));
  if (conditions.temp != null) request += '&tempf=' + conditions.temp.f;
  if (conditions.dewpoint != null) request += '&dewptf=' + conditions.dewpoint.f;
  if (conditions.windSpeed != null) request += '&windspeedmph=' + conditions.windSpeed.mph;
  if (conditions.windGust != null) request += '&windgustmph=' + conditions.windGust.mph;
  if (conditions.winddir != null) request += '&winddir=' + conditions.winddir;
  if (conditions.pressure != null) request += '&baromin=' + conditions.pressure.inHg;
  if (conditions.humidity != null) request += '&humidity=' + conditions.humidity;
  if (conditions.uv != null) request += '&uv=' + conditions.uv;
  if (conditions.solarRadiation != null) request += '&solarradiation=' + conditions.solarRadiation;
  if (conditions.precipRate != null) request += '&rainin=' + conditions.precipRate.in;
  if (conditions.precipTotal != null) request += '&dailyrainin=' + conditions.precipTotal.in;
  request += '&softwaretype=appsscriptforwarder&action=updateraw&realtime=1&rtfreq=60';
I will leave it at that and let it to be an excercise for the reader to figure out. Once user friendly api will be provided and European metrics will be accepted directly I will update this section. Unlike flightradar who gives you a business subscription for helping the project they offer you nothing in return so at very least make your API user friendly.
Step 15: Closure and ToDo List


Just a quick recap, I would again note the best thing to do is avoid these small plastic all in one stations because of the obvious (small place to work with, possible water flooding due to the water block, the station will heat up at the summer no matter what so those little air hole rings protecting the temperature sensor will do absolutely nothing). If you want to make the temperature precise better to use a standalone white box and mount the sensor in the middle of it on a way it can't even get heated up by it's support pole.
You see the irony, that the main problem with my Natalia Weather Station was the incorrect temperature readings due to the box heating up when the sun shine on it. With this new station it's the exact same issue. One very simple workaround could be to mount the station on a place where it's in shadow during the whole day (eg: making a top tent like structure above it and leaving a proper hole for the rain to come down).
Here comes the million dollar question: after you built your station how do you know that it is accurate? Simple just compare it to commercial weather services like weatherunderground with many sensors on many locations, you will not get the exact telemetry but that's the point of building your own station anyway ... If something is way off then you have a problem.
For example for me not being able to have the station mounted on the roof just on a balcony, neither the wind speed nor the wind direction will ever be perfect even if the sensors are properly calibrated.
This build was not a smooth sail. Even after finally squeezing everything into the box I tried to separate the RPI with a wall from the rain chamber which didn't fully work and the whole PI section got underwater: results: PI dead, camera dead, SDcard dead. Second time I tried to hurry up just to complete the build finally and I have melted out the bottom of the station with a hot air gun under the window and tried to mount a PI in there in a regular medicine bottle after waterproofing it. Failed miserably at the final assembly the USB port snapped out and when I tried to open the airtight bottle my knife run off taking out a chunk of the PCB of the PI = RIP. For the third time I decided to do it right went into a local hardware store got some approx 7cm diameter water pipe and built both the PI and cam in it. By this time the station's bottom was dremeled out so badly that I had to use silicone paste to fill the whole thing out. Pumping the whole thing full of silicon paste kind of made the PI part irreparable.
As a final touch I was thinking on adding an extra white aluminum plate around the PI and the temperature sensor on the bottom to create extra shadow but this is the typical "putting lipstick on a pig" scenario. The top of the station will just heat up to the point it will transmit that heat so on the summer in 30-40C this station will be way off again just like my old one but lessons learned :)
As always a lot of things could be improved in the future, some I can think of right now:
- Drop the all in one design and make space for separate sensors (maybe after I have a house with a garden)
- Radio communication is insecure (plain text), in case you want to protect the weather data implement some :) more seriously the radio can be flooded easily if an attacker knows the channel + baud rate, making the system unusable
- Radio communication could be more efficient (eg: sending binary or compressed data instead of 8 data columns in ASCII)
- Radio communication could implement re-sending and an ACK system in case of non-reception (this would cause plethora of other issues I won't go into in this writing)
- Indoor sensor data could be sent back to the base station (logging the internal temperature, humidity on the PI), since the HC12 is a trans-receiver no additional hardware is needed in this case however to avoid collisions this should be implemented on a way like after the base sent out it's telemetry and the client successfully received and decoded it, sends back it's own telemetry in a different format (so the relay clients will ignore it). This way it knows the channel is clear to send for a minute.
- More sensors could be added (UV index, MQ2 maybe)
- As noted earlier for precise per hour averaging (rain/wind/light) the Arduino needs to know the time, this could be provided by the Raspberry PI
- The station can be easily modified to be self contained (don't use any external services), in that case using Zabbix for plotting would be an overkill for the PI but you could easily add a Munin, MRTG on the same host. Even the flight radar part is doable with VirtualRadar and mono. In this case the only external service the station really needs is just the accurate time from an NTP server
I hope this Instructable was informative and helps everybody building her/his custom made weather station for the home.

Participated in the
For the Home Contest


![Tim's Mechanical Spider Leg [LU9685-20CU]](https://content.instructables.com/FFB/5R4I/LVKZ6G6R/FFB5R4ILVKZ6G6R.png?auto=webp&crop=1.2%3A1&frame=1&width=306)