

Introduction: Mind Control 2: Spectrum Analyser


This instructable explains how to build a spectrum analyser that uses a fast fourier transform (FFT) to detect the presence of the different signals within a complex waveform.
This project uses an Arduino Uno R3 and the TFT graphics display described in my instructable https://www.instructables.com/id/Arduino-TFT-Grap...
Software covering each of the following frequency ranges is presented: [1]
- DC .. 32Hz
- DC .. 64Hz
- DC .. 128Hz
- DC .. 256Hz
- DC .. 512Hz
- DC .. 1024Hz
- DC .. 2048Hz
- DC .. 3200Hz
The estimated cost of parts for this project is less than $20.
Photos
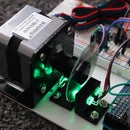
Cover photo: shows the spectrum analyser and the frequency spectrum for a 6Hz square-wave
Video: the video confirms that a square-wave comprises a fundamental and odd harmonics
Notes
[1]
DC stands for Direct Current which equates to a frequency of 0Hz
Step 1: Parts List
The following parts were obtained from https://www.aliexpress.com/:
- 1 only 2.2 Inch TFT SPI LCD Display Module 240*320 ILI9341 with SD Card Slot for Arduino Raspberry Pi 51/AVR/STM32/ARM/PIC [1]
- 1 only Prototype PCB Expansion Board For Arduino ATMEGA328P UNO R3 Shield FR-4 Fiber PCB Breadboard 2mm 2.54mm Pitch
The following parts were obtained locally:
- 5 only 2K2 ohm 1/8 watt metal film resistors
- 5 only 3K3 ohm 1/8 watt metal film resistors
- 2 only 10K ohm 1/8 watt metal film resistors
- 1 only 1uF tantalum capacitor
- 1 only 40 pin header terminal strip 0.1"/2.54mm pitch for PCBs
- 10 amp tinned copper fuse wire
The estimated cost of parts is less than $20
Step 2: Circuit


The circuit diagram for my spectrum analyser is shown in photo 1. [1]
Construction details for the matching shield (photo 2) are given in my instructable https://www.instructables.com/id/Arduino-TFT-Grap...
Notes
[1]
The Arduino A0 input should be biased to mid-rail potential when using the spectrum analyser in a stand-alone mode.
This centers the positive and negative-going waveform peaks within the range 0..5 volts.
Step 3: Theory


Sinewaves comprise a single frequency
Complex waveshapes comprise several sinewaves each with a different amplitude, frequency, and phase. A squarewave for example has a fundamental sinewave and all odd harmonics
A spectrum analyser decomposes the input waveform into its constituent frequencies whereas an oscilloscope just displays the waveshape.
Images
Photo 1 shows the oscilloscope trace for a 6Hz sinewave and the matching spectrum analyser trace. Note the absence of any harmonics ... a sinewave is not a complex waveform
Photo 2 shows the oscilloscope trace for a squarewave and the matching spectrum analyser trace. The spectrum analyser has detected the fundamental and its odd harmonics.
fix_FFT output
The fix_FFT software used in this spectrum analyser outputs numbers. A large number indicates the presence of a frequency. [1]
Photo 3 shows the numbers for a 6Hz sinewave ... there is only one large number
Photo 4 shows the numbers for a 6Hz squarewave ... there are three bins with a large number.
Note that the 3rd harmonic at 18Hz has 1/3rd of the fundamental amplitude, and that the fifth harmonic at 30Hz has 1/5th of the fundamental amplitude.
Frequency Bins
The number of frequencies that are assigned to a bin depends on the sampling-frequency and the number of samples.
If the sampling frequency is 64Hz and the number of samples is also 64 then each bin will be 1Hz wide.
If we increase the sampling frequency by a factor of 4 then each bin will be 4Hz wide. For example the number in bin[6] would represent 24Hz, 25Hz, 26Hz, and 27Hz.
The examples shown in the above photos have a bin-width of 1Hz for ease of explanation.
Sampling theory (Nyquist) says that we only need look at the first 32 bins if the number of samples is 64.
Notes
[1]
This Youtube video explains the Fourier transform in a visual manner
Step 4: Design Consideration
The Arduino analog-to-digital convertors have a number of design requirements
Bias
The waveform peaks to your Arduino analog-to-digital (A/D) converters must not go below zero volts or exceed +5volts.
Assuming a 2 volt peak-peak input waveform, then a DC bias of at least 1volt is required.
This may be achieved using:
- a resistive voltage-divider and a coupling capacitor
- op-amp offset voltages connected to the A/D
I prefer the second method as coupling capacitors limit the low frequency response.
Numbers
The A/D convertor outputs 1023 for a +5 volt input, and 0 for zero volts.
The fix_FFT.ino library expects numbers in the range 0..255.
The following code lines address these requirements:
- short value = analogRead(adc_input);
- data[i] = map(value, 0, 1023, 0, 255);
Maximum sampling frequency
“For a 16 MHz Arduino the ADC clock is set to 16 MHz/128 = 125 KHz. Each conversion in AVR takes 13 ADC clocks so 125 KHz /13 = 9615 Hz.
That is the maximum possible sampling rate, but the actual sampling rate in your application depends on the interval between successive conversions calls.” [1]
In practice I have found the maximum sample rate to be 8192Hz when sending FFT (fast fourier transform) data to my PC
DC Offset
The DC offset from the input voltage divider only affects bin[0].
My code automatically subtracts the startup reading from all subsequent readings which allows me to track any changes.
Notes
[1]
Step 5: Software
Software covering each of the following frequency ranges is attached
- fix_FFT_DC_32Hz.ino
- fix_FFT_DC_64Hz.ino
- fix_FFT_DC_128Hz.ino
- fix_FFT_DC_256Hz.ino
- fix_FFT_DC_512Hz.ino
- fix_FFT_DC_1024Hz.ino
- fix_FFT_DC_2048Hz.ino
- fix_FFT_DC_3200Hz.ino
Copy the contents of your chosen package into a fresh arduino sketch, save it using the same name but without the .ino extension, then upload it to your Arduino.
The bin-widths are the highest package frequency divided by 32
For convenience the horizontal scale is labelled in Hz ... this assumes that each bin is 1Hz wide.
The actual frequency is the display frequency times the highest package frequency divided by 32
Examples:
20Hz using fix_FFT_DC_32Hz.ino is 20Hz*32/32 = 20Hz
20Hz using fix_FFT_DC_512Hz.ino is 20Hz*512/32 = 320Hz
20Hz using fix_FFT_DC_3200Hz.ino is 20Hz*3200/32 = 2000Hz

Step 6: Summary
This instructable explains how to make a spectrum analyser.
The operation is also explained with the aid of design notes, videos, and photos.
FFT software for 8 frequency ranges has been provided.
The estimated cost of parts is less than $20.
Click here to view my other instructables.

![Tim's Mechanical Spider Leg [LU9685-20CU]](https://content.instructables.com/FFB/5R4I/LVKZ6G6R/FFB5R4ILVKZ6G6R.png?auto=webp&crop=1.2%3A1&frame=1&width=306)


